Python Test
Here I am explaining why I did this project, the business context and what I hope to gain… random link for more information.
Still explaining random things about the analysis and what is about to GO DOWN.
First section Aye
Testing the first section. Blah blah explaining the post yeah yeah…
Ok go off..
Yeahhhh heres my sick post sick. Here is the accuracy of my model and the data issues I encountered along the way
Key takeaways
Includea bunch of context about what you did and why, plus the takeaways, learnings.
import numpy as np
import pandas as pd
import matplotlib.pyplot as plt
%matplotlib inline

| threshold | precision | recall | |||||||
|---|---|---|---|---|---|---|---|---|---|
| mean | std | min | max | mean | std | min | max | ||
| 95 | 0.95 | 0.957283 | 0.060039 | 0.857143 | 1.0 | 0.442526 | 0.229691 | 0.100000 | 0.800000 |
| 96 | 0.96 | 0.957283 | 0.060039 | 0.857143 | 1.0 | 0.442526 | 0.229691 | 0.100000 | 0.800000 |
| 97 | 0.97 | 0.954832 | 0.064307 | 0.833333 | 1.0 | 0.410431 | 0.233079 | 0.100000 | 0.800000 |
| 98 | 0.98 | 0.944795 | 0.081874 | 0.750000 | 1.0 | 0.345867 | 0.206159 | 0.076923 | 0.727273 |
| 99 | 0.99 | 0.930672 | 0.106333 | 0.666667 | 1.0 | 0.283582 | 0.178153 | 0.076923 | 0.666667 |
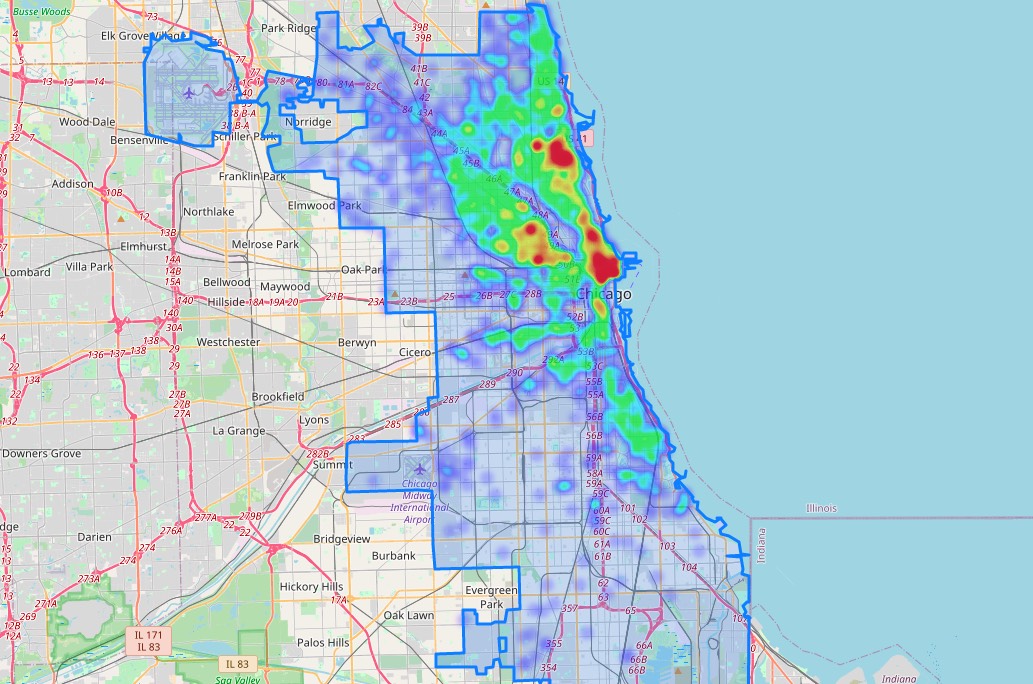
Attempt at using my interactive matplotlib
Pictured below.


Leave a comment